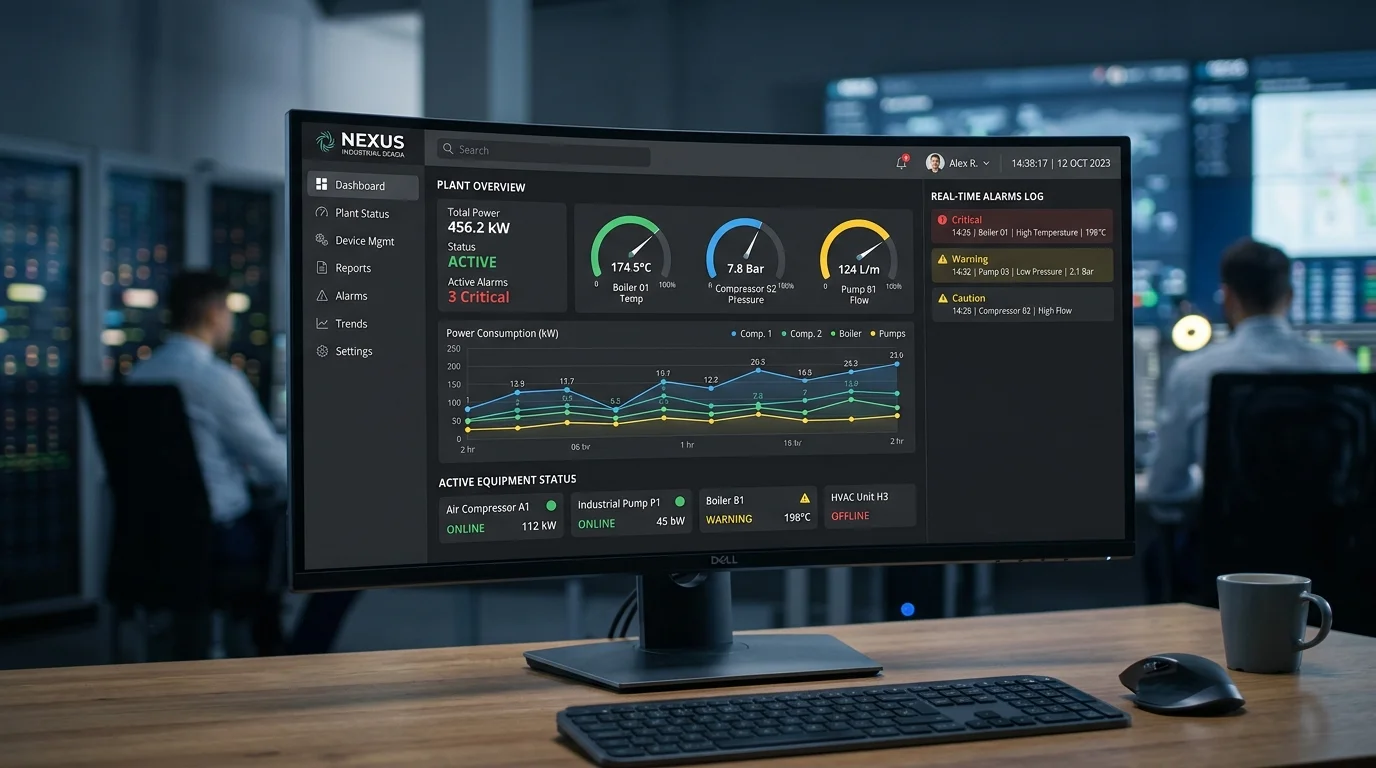
EMS Software (Energy Management System) is a specialized digital platform designed to automate data collection, provide visual analytics, continuously monitor, and optimize all energy utility vectors within manufacturing facilities — spanning electricity, water, compressed air, steam, fuel oil, and natural gas — in full alignment with international ISO 50001 energy governance standards and Vietnamese statutory greenhouse gas accounting frameworks (Decree 06/2022/ND-CP and Decision 42/2026/QD-TTg).
This technical guide is part of DeviceLab's comprehensive engineering handbook on factory energy monitoring system.
📌 5 Mandatory Features of ISO 50001 EMS Software (Key Takeaways):
- Establishing Energy Baselines (EnB): Mathematical modeling of normalized energy consumption correlated against factory production volume, ambient temperatures, and shift work schedules.
- Calculating Energy Performance Indicators (EnPI): Real-time tracking of specific energy intensity ratios per product unit (kWh / unit or kWh / ton).
- Multi-Tier Utility Tariff Analytics: Granular breakdown of utility expenditures incurred during Peak, Normal, and Off-Peak time windows to optimize production shift scheduling.
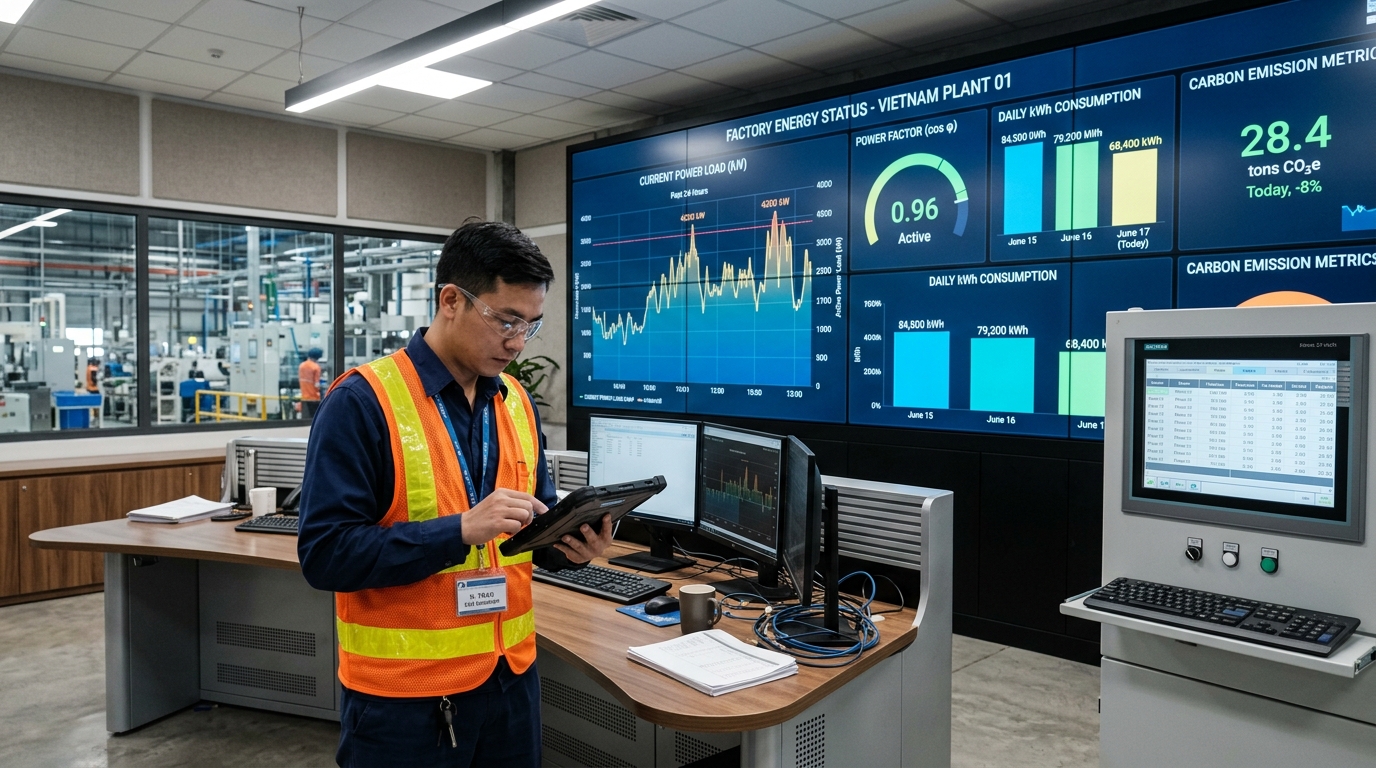
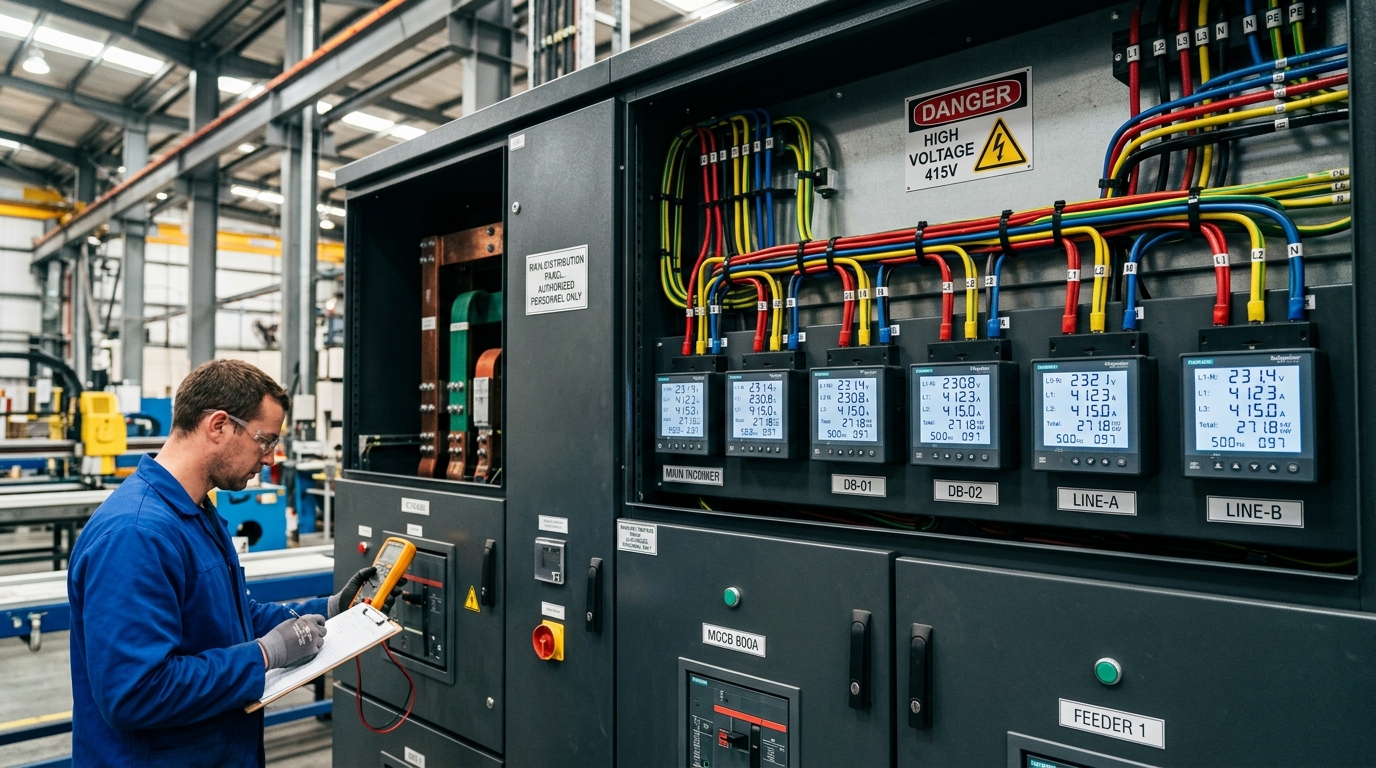
- Real-Time Power Quality Alarms: Continuous surveillance of voltage sags, overcurrent, phase unbalance, and alerts when power factor (Cos Phi) drops below 0.90 to eliminate utility surcharges.
- Automated Greenhouse Gas Emission Audits: Seamless conversion of kilowatt-hours and fossil fuels into carbon dioxide equivalent emissions (tCO2e) for statutory compliance and ESG reports.
Why Manual Spreadsheets Are Obsolete for Energy Management
Many factories still assign maintenance staff to manually record meter readings at 08:00 each morning and transcribe them into Excel. This outdated methodology fails when confronting 3 major operational challenges in 2026:
- Inability to Isolate 15-Minute Peak Demand Spikes: Power utilities calculate maximum demand charges based on the single highest 15-minute load peak. If a 250kW motor starts up concurrently with a heat-treating furnace, the facility is slapped with heavy peak demand charges that an end-of-day Excel log can never diagnose.
- Absence of Energy-to-Production Correlation: When monthly electric bills surge by 15%, executive management cannot determine whether increased production output or deteriorating machine efficiency was the cause without automated EnPI calculations.
- Mandatory Greenhouse Gas Audits under Decision 42/2026/QD-TTg: Major energy-consuming facilities (consuming ≥ 1,000 TOE or ≥ 6 million kWh/year) are legally required to submit verifiable carbon audit reports substantiated by automated telemetry records.
Deployment Architecture Comparison: On-Premise vs. Cloud SaaS
| Comparison Attribute | On-Premise EMS (Local Server) | Cloud SaaS EMS (Managed Cloud) |
|---|---|---|
| Upfront Capital Investment | High (Physical server hardware, Windows Server, SQL licenses) | Minimal (Predictable annual software subscription) |
| Deployment Speed | 4 - 8 weeks (OS installation, IT network firewall configuration) | 1 - 3 days (Gateways auto-provision upon powering up) |
| Remote Mobile Access | Confined to internal LAN (Demands complex corporate VPNs) | Accessible anywhere via mobile apps (iOS, Android, Web browser) |
| Maintenance & Backup | Plant IT personnel must execute manual database backups | Automated daily cloud backups with guaranteed 99.9% uptime |
Experience the DeviceLab EMS Software Platform
Connect unlimited power meters across any brand. Built-in EnPI dashboards, multi-tier tariff optimization, and automated greenhouse gas inventory compliance reporting.
Solutions Helpline: (+84) 982.503.355