Overall Equipment Effectiveness (OEE) is the gold standard benchmark evaluating the operational health and productivity of industrial production lines across 3 core pillars: Availability (machine uptime), Performance (production operating speed), and Quality (ratio of conforming units). However, over 85% of manufacturing plants in Vietnam still compute OEE via manual paper clipboards or end-of-day Excel entries — an error-prone, subjective process suffering data latency of 12 to 24 hours. This guide details how optical sensors, current transformers, and the DL-M400 IoT module fully digitize and calculate OEE in real time.
This technical guide is part of DeviceLab's comprehensive engineering handbook on industrial IoT for machinery and equipment.
📌 Automated OEE Formulas & Architecture (Key Takeaways):
- Standard International OEE Formula:
OEE (%) = Availability (%) × Performance (%) × Quality (%). The recognized World-Class OEE benchmark is ≥ 85% (Availability ≥ 90%, Performance ≥ 95%, Quality ≥ 99.9%). - Acquiring Availability (A): Current sensors (CTs) or optocoupled dry contacts measure true Operating Time versus Planned Production Time, automatically logging unplanned Downtime events.
- Acquiring Performance (P): Optical sensors or rotary encoders measure instantaneous cycle times, comparing actual throughput against Ideal Cycle Time to surface hidden micro-stops.
- Acquiring Quality (Q): Tallies total parts produced and subtracts reject units (NG) logged via classification sensors or QA operator confirmation buttons.
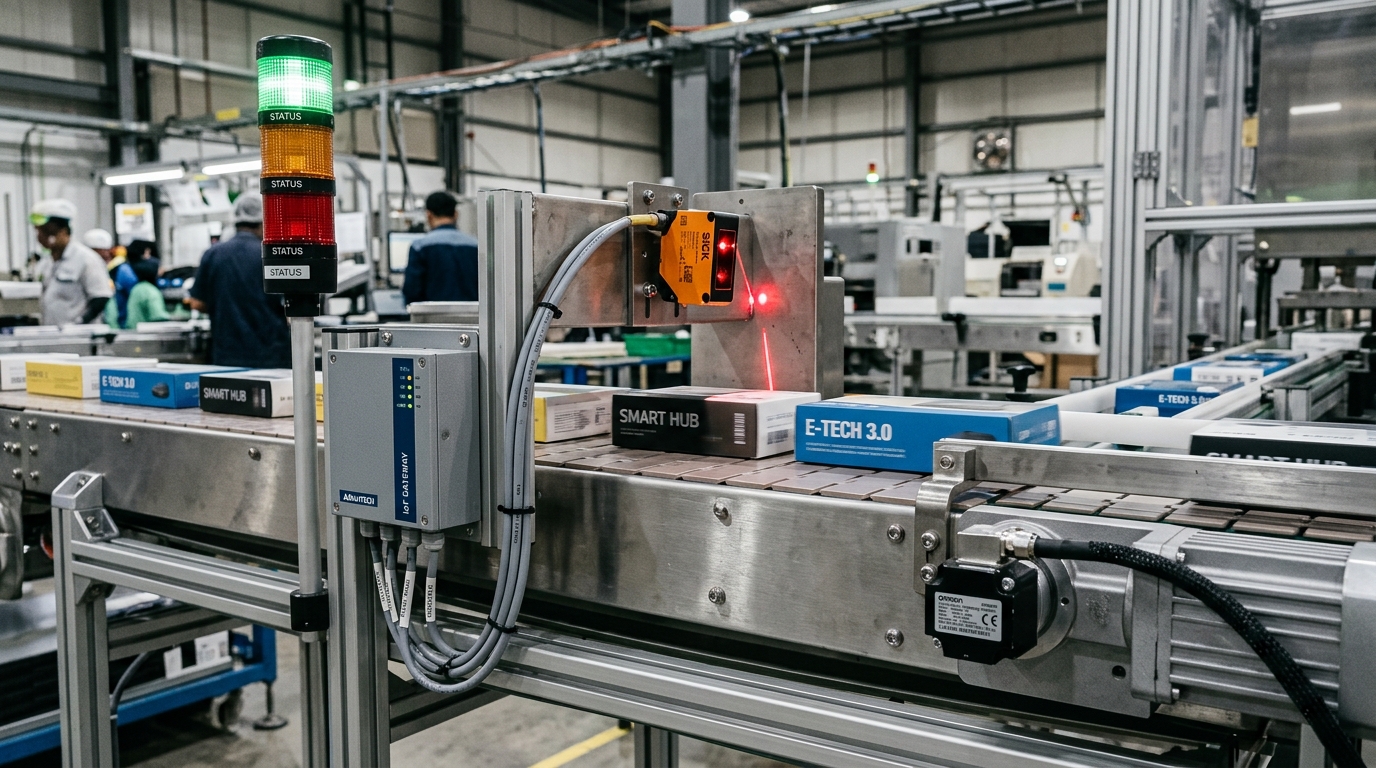
The 3 Core Pillars of OEE and Their IoT Sensor Implementations
1.1. Measuring Machine Availability (A)
Availability reflects the percentage of planned production time during which the equipment is genuinely executing work:
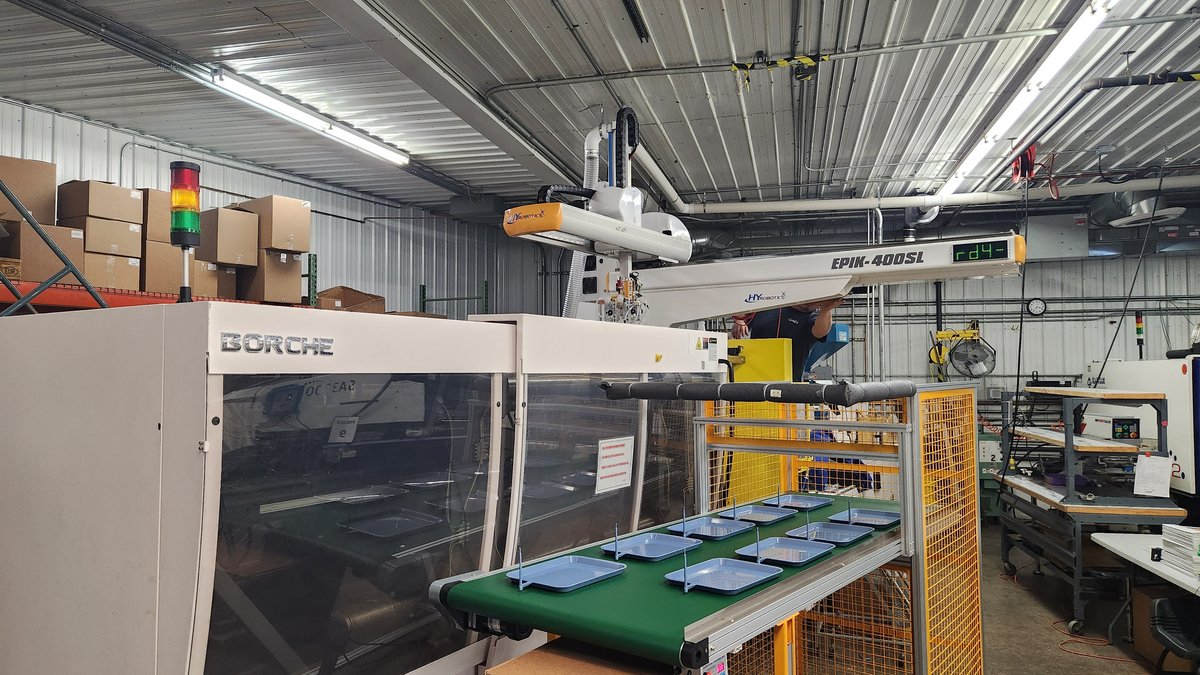
Automated Acquisition Method: The DL-M400 IoT module utilizes optically isolated Digital Inputs (DI) wired in parallel across the machine's green RUN stack light or main motor contactor auxiliary contacts. When the machine engages, an ON state is logged; when it disengages, an OFF state instantly triggers downtime duration timers. Operators can log stoppage reasons (Material Shortage, Mold Changeover, Mechanical Breakdown) on a ruggedized terminal tablet mounted at the machine.
1.2. Measuring Operating Performance (P)
Performance reflects actual manufacturing throughput speed compared against designed nameplate speeds:
Automated Acquisition Method: Diffuse photoelectric sensors or inductive proximity switches mounted at the outfeed conveyor pulse a digital voltage signal each time a part clears the station. The DL-M400 processor tallies these pulses at up to 10kHz, computing parts-per-minute throughput against target work-order takt times.
1.3. Measuring Product Quality (Q)
Quality reflects the ratio of conforming parts passing final inspection against total units fabricated:
Automated Acquisition Method: Integrated directly with pneumatic diverter gates or quality inspection pushbuttons logged by QA technicians.
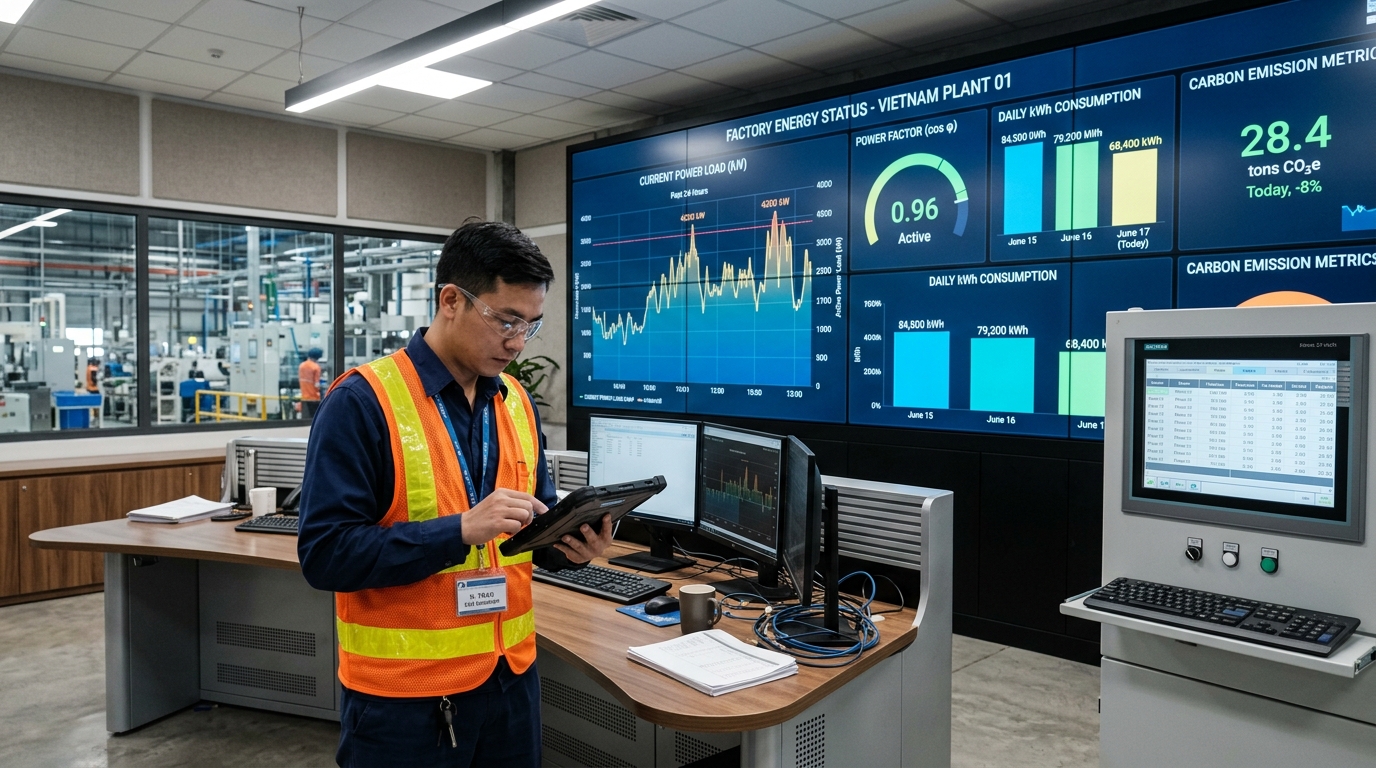
Comparison: Manual Paper Logs vs. Automated IoT Telemetry
| Comparison Attribute | Paper Clipboards / Manual Excel | Automated IoT Sensor Telemetry |
|---|---|---|
| Data Latency | 12 to 24-hour delay (Data aggregated after shift ends) | Real-time (< 2 seconds update rate) |
| Data Authenticity & Objectivity | Prone to manipulation; operators conceal stoppage events | 100% objective, sensor-derived, tamper-proof |
| Micro-Stop Tracking | Completely misses brief stoppages under 5 minutes | Detects micro-stoppages down to 1-second increments |
| Productivity Impact | Passive historical record keeping | Drives 10% to 18% OEE improvements within 3 months |
Deploy Automated OEE with DeviceLab
The DL-M400 hardware package pairs with optical counters, Andon lights, and interactive OEE web dashboards. Non-intrusive installation without modifying existing machine PLC logic.
OEE Systems Engineer: (+84) 982.503.355